News Next article
Asking prices gain as most Kiwi look past the election
Property Pulse Report - September 2026
By Gavin Lloyd 19 October 2026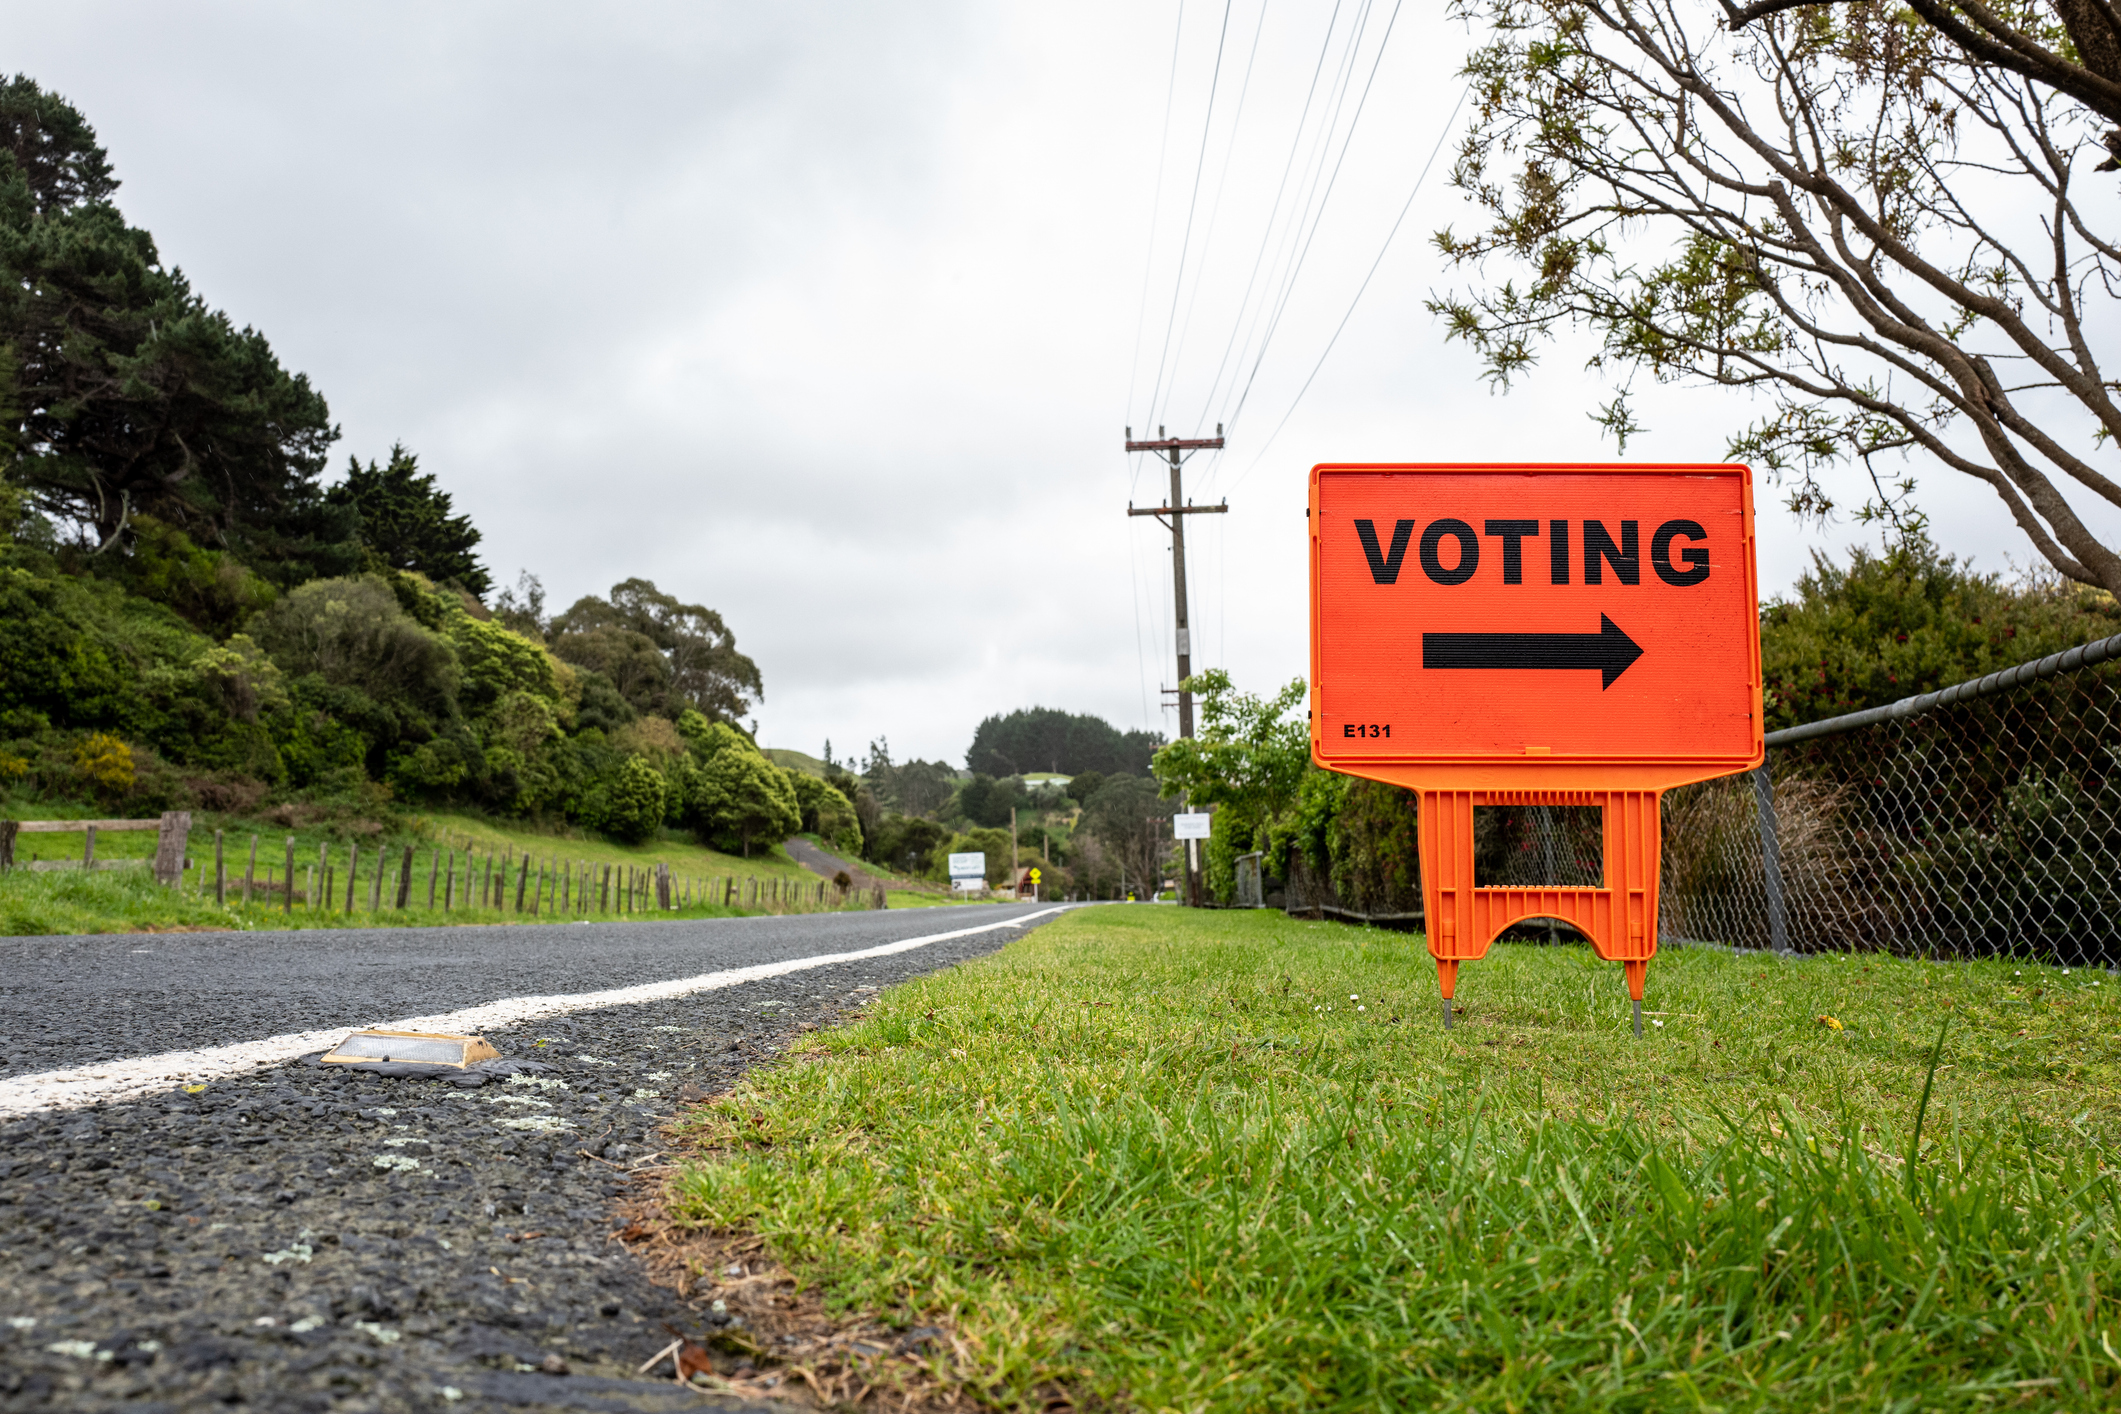
Only one in five sellers say the election is affecting their decision.
Asking prices have lifted for a second month in a row, and most buyers and sellers say the upcoming election isn’t changing their plans, according to the latest Trade Me Property Pulse Report.
The national average asking price rose 0.8 per cent in September to $835,050, the second consecutive month of growth, following five straight months of decline between March and July. Year-on-year, national asking prices are 0.4 per cent higher.
Trade Me Property Customer Director Gavin Lloyd says the modest lift in asking prices is quietly encouraging.
“Back-to-back monthly gains are positive following a softer winter.
“We’re seeing a steady recovery from the mid-year dip, and with the average asking price still 5 per cent below February’s peak, there’s room for that recovery to continue,” says Mr Lloyd.
He says the market is also well balanced from a supply and demand perspective with searches down 6 per cent on last spring, and new listings dipped slightly.
“Buyers have time to make decisions, and sellers aren’t competing against a flood of new stock. That’s a healthy place for the market to be heading into the busier months.
Kiwi look past the election
While Kiwi get set to head to the polls, with overseas voting this week, and advance voting next week Mr Lloyd said most buyers and sellers aren’t putting their plans on hold.
A Trade Me survey of more than 2,000 active property buyers and homeowners, found that just 20 per cent of sellers and 22 per cent of buyers saw the election as a primary influence on their decisions.
“A quarter of the sellers we surveyed said they planned to list in October regardless of election activity. Naturally we’ll be keeping a close eye on this and whether we see an increase of properties hitting the market in the coming weeks.”
South Island outpaces the North
Otago led the country in annual price growth, surging 8 per cent year-on-year to $938,800. That included a 7.5 per cent jump from August alone. The price gap between Otago and Auckland has now narrowed to roughly $53,000.
"Otago is the standout performer this month," says Mr Lloyd. "Searches in the region lifted 6% on August as spring arrived, and sellers brought 48 per cent more new listings to market over the same period. Buyer interest is still below where it was this time last year, but activity is clearly building month on month."
Most South Island regions recorded year-on-year gains, including Marlborough (+5.6%), Southland (+4.5%), Canterbury (+1.3%) and the West Coast (+0.7%).
By contrast, several North Island regions recorded annual price falls, including Taranaki (-4.3%), Auckland (-3.3%), Northland (-2.3%) and Wellington (-1.4%).
Nelson/Tasman recorded the largest annual decline nationwide, down 4.8 per cent in September.
Auckland stays under $1 million
Auckland's average asking price landed at $992,000 in September, its fourth straight month below the $1 million mark.
"Auckland buyers have plenty of choice," says Mr Lloyd. "New listings in the region were up close to 6 per cent year-on-year, while searches fell nearly 5 per cent.
“More stock and less competition keep buyers in a strong position when negotiating."
Urban property under pressure, but units hold firm
Higher-density properties continued to soften. The national average asking price for apartments, townhouses and units was down 4 per cent year-on-year.
Auckland saw falls across urban stock of nearly 8 per cent, and Wellington recorded a 6 per cent drop. Smaller properties in Christchurch City proved more resilient, up around 1.7 per cent.
"Recent years have brought significant townhouse construction to our main centres, and that added inventory is weighing on prices," says Mr Lloyd.
"For first home buyers, this segment remains one of the most accessible entry points right now. It's a solid opportunity for those with finance to get on the property ladder."
Within the smaller urban segment, units bucked the trend, rising 1.8 per cent nationally and 4.7 per cent in Christchurch City.
Across all other property types, Christchurch City was the only main centre to record annual growth, up 2.5 per cent to $725,600. Auckland City fell 1 per cent to $1,177,800, while Wellington City was flat at $845,150.
| Region | Property Price Index | YoY % change | |||
|---|---|---|---|---|---|
| Auckland | Auckland | $992,000 | $992,000 | -3.3% | -3.3% |
| Bay of Plenty | Bay of Plenty | $867,900 | $867,900 | 0.8% | 0.8% |
| Canterbury | Canterbury | $733,000 | $733,000 | 1.3% | 1.3% |
| Gisborne | Gisborne | $634,700 | $634,700 | 0.9% | 0.9% |
| Hawke's Bay | Hawke's Bay | $754,150 | $754,150 | 1.5% | 1.5% |
| Manawatū/Whanganui | Manawatū/Whanganui | $574,250 | $574,250 | 0.2% | 0.2% |
| Marlborough | Marlborough | $760,150 | $760,150 | 5.6% | 5.6% |
| Nelson/Tasman | Nelson/Tasman | $766,600 | $766,600 | -4.8% | -4.8% |
| Northland | Northland | $731,900 | $731,900 | -2.3% | -2.3% |
| Otago | Otago | $938,800 | $938,800 | 8.2% | 8.2% |
| Southland | Southland | $558,250 | $558,250 | 4.5% | 4.5% |
| Taranaki | Taranaki | $634,200 | $634,200 | -4.3% | -4.3% |
| Waikato | Waikato | $817,350 | $817,350 | 1.2% | 1.2% |
| Wellington | Wellington | $762,250 | $762,250 | -1.4% | -1.4% |
| West Coast | West Coast | $479,950 | $479,950 | 0.7% | 0.7% |
Explore Past Property Market Reports
How much is the election influencing buyers and sellers? August 2026
- Deep South drives property market, July 2026
- House prices fall, alongside the temperatures, June 2026

Author

Other news you might like


