News Next article
House prices stand steady as survey shows optimism slump
Property Pulse Report - May 2026
By Gavin Lloyd 10 June 2026
New winter survey shows property optimism slumps
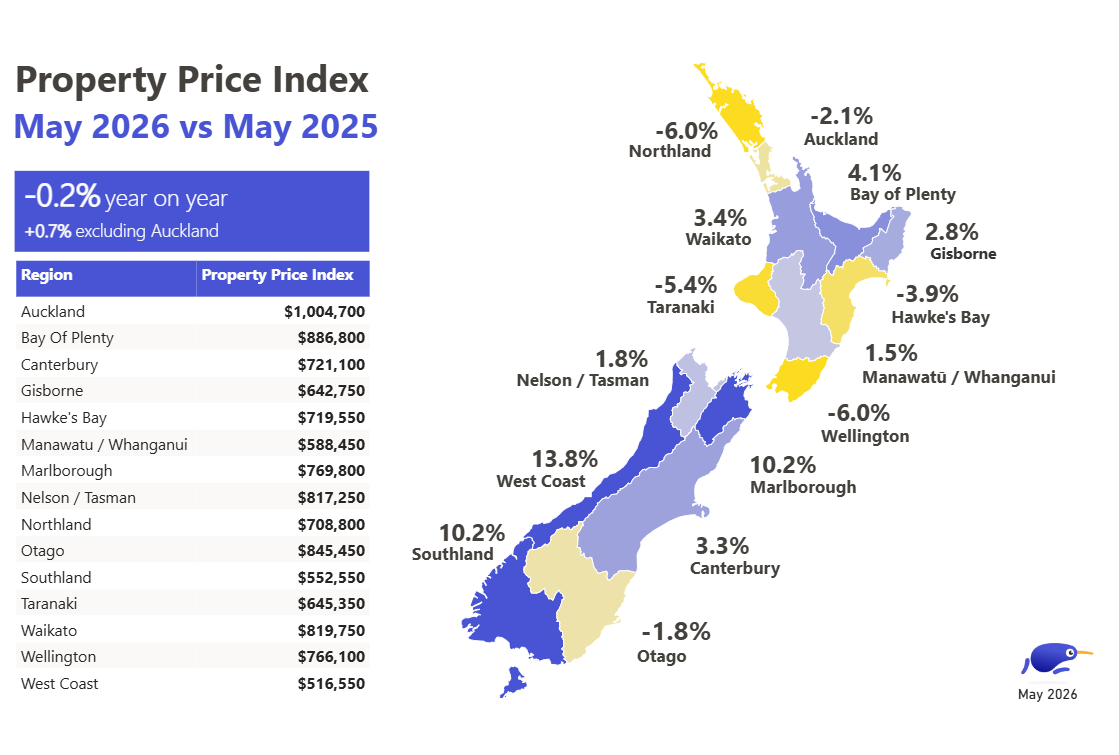
Property prices May 2025 - May 2026
Buyer mindsets: More Kiwi looking to purchase but cost living tops concerns
Seller mindsets: Active sellers on the rise, while confidence dips
| Region | Property Price Index | YoY % change | |||
|---|---|---|---|---|---|
| Auckland | Auckland | $1,004,700 | $1,004,700 | -2.1% | -2.1% |
| Bay of Plenty | Bay of Plenty | $886,800 | $886,800 | 4.1% | 4.1% |
| Canterbury | Canterbury | $721,100 | $721,100 | 3.3% | 3.3% |
| Gisborne | Gisborne | $642,750 | $642,750 | 2.8% | 2.8% |
| Hawke's Bay | Hawke's Bay | $719,550 | $719,550 | -3.9% | -3.9% |
| Manawatuū/Whanganui | Manawatuū/Whanganui | $588,450 | $588,450 | 1.5% | 1.5% |
| Marlborough | Marlborough | $769,800 | $769,800 | 10.2% | 10.2% |
| Nelson/Tasman | Nelson/Tasman | $817,250 | $817,250 | 1.8% | 1.8% |
| Northland | Northland | $708,800 | $708,800 | -6.0% | -6.0% |
| Otago | Otago | $845,450 | $845,450 | -1.8% | -1.8% |
| Southland | Southland | $552,550 | $552,550 | 10.2% | 10.2% |
| Taranaki | Taranaki | $645,350 | $645,350 | -5.4% | -5.4% |
| Waikato | Waikato | $819,750 | $819,750 | 3.4% | 3.4% |
| Wellington | Wellington | $766,100 | $766,100 | -6.0% | -6.0% |
| West Coast | West Coast | $516,550 | $516,550 | 13.8% | 13.8% |
Explore Past Property Market Reports
Most properties, more choice
Explore endless possibilities on NZ's favourite property app.
Download for iOS Download for Android 
Author
