News Next article
Southland and small homes lead property price growth
Property Pulse Report - April 2026
By Gavin Lloyd 8 May 2026
The national average asking price in Aotearoa reached $855,050 in April, a 2.3 per cent increase compared to a year ago, according to the latest Trade Me Property Pulse Report.
The report highlights a market characterised by stability and increasing choice for buyers, with new listings up 3.3 per cent annually.
Trade Me Property Customer Director Gavin Lloyd says the data reflects a balanced market.
“We’re seeing a steady annual climb in prices alongside a healthy increase in stock. This combination gives buyers more options and suggests a level of confidence from sellers as we head toward the cooler months,” says Mr Lloyd.
Property prices April 2025 - April 2026
Regional standouts and market volatility
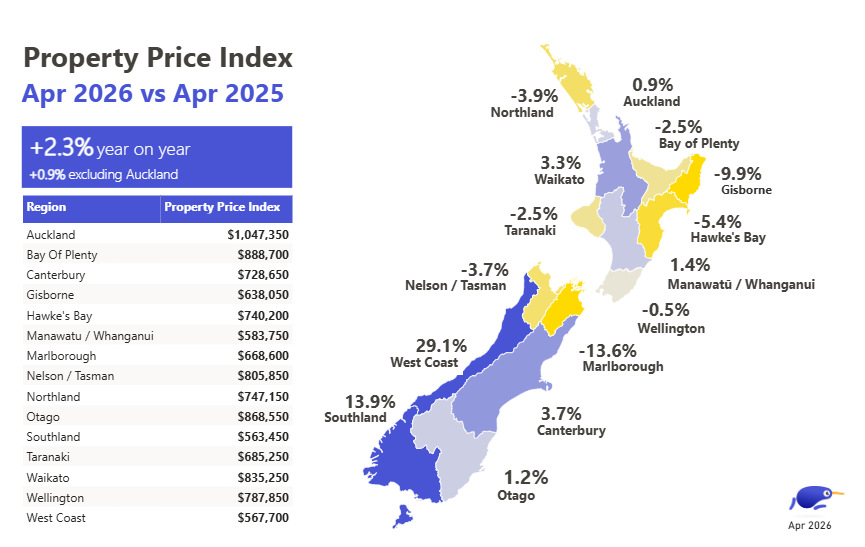
While the national trend is one of steady growth, Southland has proven to be a significant regional mover with asking prices in the region up nearly 14 per cent year-on-year, reaching an average of $563,450 in April.
The West Coast also recorded a sharp annual jump of 29 per cent. However, Mr Lloyd cautions that these smaller regions can experience more price fluctuation.
“Smaller markets like the West Coast often see higher volatility because even a small shift in the volume or type of stock can significantly impact the average asking price,” he explains.
In Tāmaki Makaurau, prices remained resilient. Despite a minor 2 per cent month-on-month dip, Auckland’s average asking price sits comfortably over the million dollar mark at $1,047,350, up 0.9 per cent on April 2025.
Small homes find their stride
Interest in smaller, more affordable dwellings continues to outpace larger family homes, with
asking prices for 1-2 bedroom properties up 3.2 per cent annually to $606,850, while the average for 3-4 bedroom homes grew by a more modest 2.8 per cent.
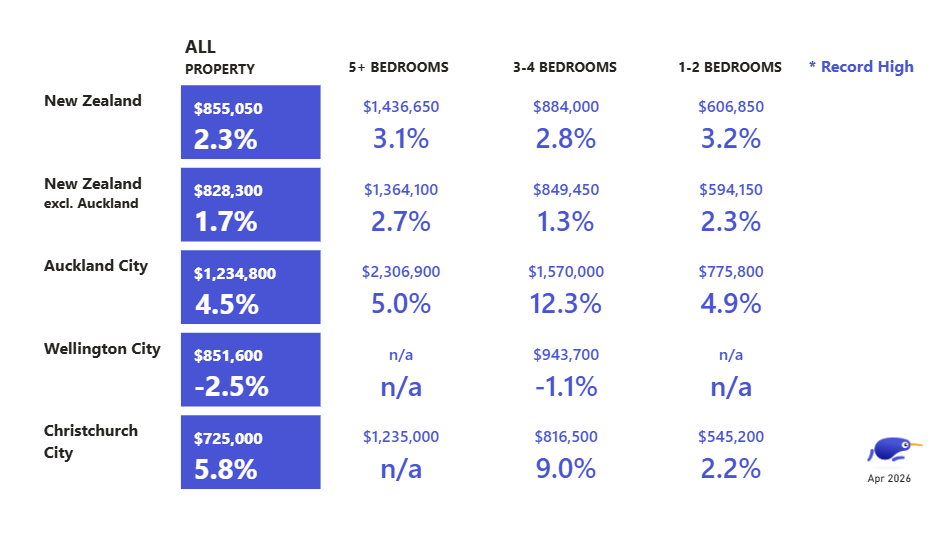
“The 1-2 bedroom segment is a key indicator of market health, as it's often the entry point for first-home buyers. Seeing this segment outperform the national average highlights where the current competitive energy is focused,” says Mr Lloyd.
| Region | Property Price Index | YoY % change | |||
|---|---|---|---|---|---|
| Auckland | Auckland | $1,047,350 | $1,047,350 | 0.9% | 0.9% |
| Bay of Plenty | Bay of Plenty | $888,700 | $888,700 | -2.5% | -2.5% |
| Canterbury | Canterbury | $728,650 | $728,650 | 3.7% | 3.7% |
| Gisborne | Gisborne | $638,050 | $638,050 | -9.9% | -9.9% |
| Hawke's Bay | Hawke's Bay | $740,200 | $740,200 | -5.4% | -5.4% |
| Manawatuū/Whanganui | Manawatuū/Whanganui | $583,750 | $583,750 | 1.4% | 1.4% |
| Marlborough | Marlborough | $668,600 | $668,600 | -13.6% | -13.6% |
| Nelson/Tasman | Nelson/Tasman | $805,850 | $805,850 | -3.7% | -3.7% |
| Northland | Northland | $747,150 | $747,150 | -3.9% | -3.9% |
| Otago | Otago | $868,550 | $868,550 | 1.2% | 1.2% |
| Southland | Southland | $563,450 | $563,450 | 13.9% | 13.9% |
| Taranaki | Taranaki | $685,250 | $685,250 | -2.5% | -2.5% |
| Waikato | Waikato | $835,250 | $835,250 | 3.3% | 3.3% |
| Wellington | Wellington | $787,850 | $787,850 | -0.5% | -0.5% |
| West Coast | West Coast | $567,700 | $567,700 | 29.1% | 29.1% |
Explore Past Property Market Reports
National average asking price hits two-year high, February 2026
Auckland property prices back over million-dollar mark, January 2026
Auckland de-throned as most expensive property market, December 2025

Author

Other news you might like

.jpg?fit=max&format=webp&quality=85)


