News Next article
Property Price Index - August 2022
Housing supply skyrockets by three quarters in 12 months
22 September 2022The number of properties for sale across Aotearoa continued to soar last month, jumping a record 76 per cent when compared with August last year, according to the latest Trade Me Property Price Index.
Trade Me Property Sales Director Gavin Lloyd said nationwide property supply had now seen a year-on-year jump for nine months straight. “While last month’s spike is partly due to the nationwide lockdown in August 2021, these increases have been on an upward trajectory all year and currently supply is well above pre-pandemic levels. Last month marked the third month in a row where we saw listing numbers spike by more than 50 per cent year-on-year.”
Region | Supply % change | Demand % change | |||
---|---|---|---|---|---|
Hawke's Bay | Hawke's Bay | +131% | +131% | +29% | +29% |
Nelson/Tasman | Nelson/Tasman | +129% | +129% | +18% | +18% |
Waikato | Waikato | +111% | +111% | +4% | +4% |
Bay of Plenty | Bay of Plenty | +109% | +109% | +14% | +14% |
Manawatū/Whanganui | Manawatū/Whanganui | +107% | +107% | +14% | +14% |
Wellington | Wellington | +98% | +98% | +22% | +22% |
Taranaki | Taranaki | +95% | +95% | +10% | +10% |
Northland | Northland | +79% | +79% | -12% | -12% |
Canterbury | Canterbury | +66% | +66% | -1% | -1% |
Auckland | Auckland | +61% | +61% | -0% | -0% |
Gisborne | Gisborne | +56% | +56% | +1% | +1% |
Otago | Otago | +49% | +49% | +4% | +4% |
Southland | Southland | +44% | +44% | +2% | +2% |
Marlborough | Marlborough | +41% | +41% | -11% | -11% |
West Coast | West Coast | +37% | +37% | +10% | +10% |
Nationwide | Nationwide | +76% | +76% | +5% | +5% |
While every region saw supply up by at least a third in August when compared with the same month last year, Mr Lloyd said there were some standouts. “Waikato saw its highest number of properties for sale ever last month, with supply more than doubling in the region when compared with August 2021.
“The Hawke’s Bay, Nelson/Tasman, Bay of Plenty, Manawatū/Whanganui regions also saw over double the number of properties for sale in August when compared with the same month last year.”
Mr Lloyd said while demand for property was also on the rise, it was no match for the large supply jumps. “Nationwide there was a 5 per cent year-on-year increase in views on properties for sale in August, with the biggest jumps in the Hawke’s Bay, Wellington, and Nelson/Tasman regions.”
As we look ahead to Summer, Mr Lloyd said prices may continue to fall yet. ”We’re only just entering the busiest period for the market now, and with a huge amount of options on the table for buyers, it’s going to be an interesting few months ahead. If these supply peaks continue to outperform demand we would expect to see prices fall even further.”
National average asking price falls for five months in a row
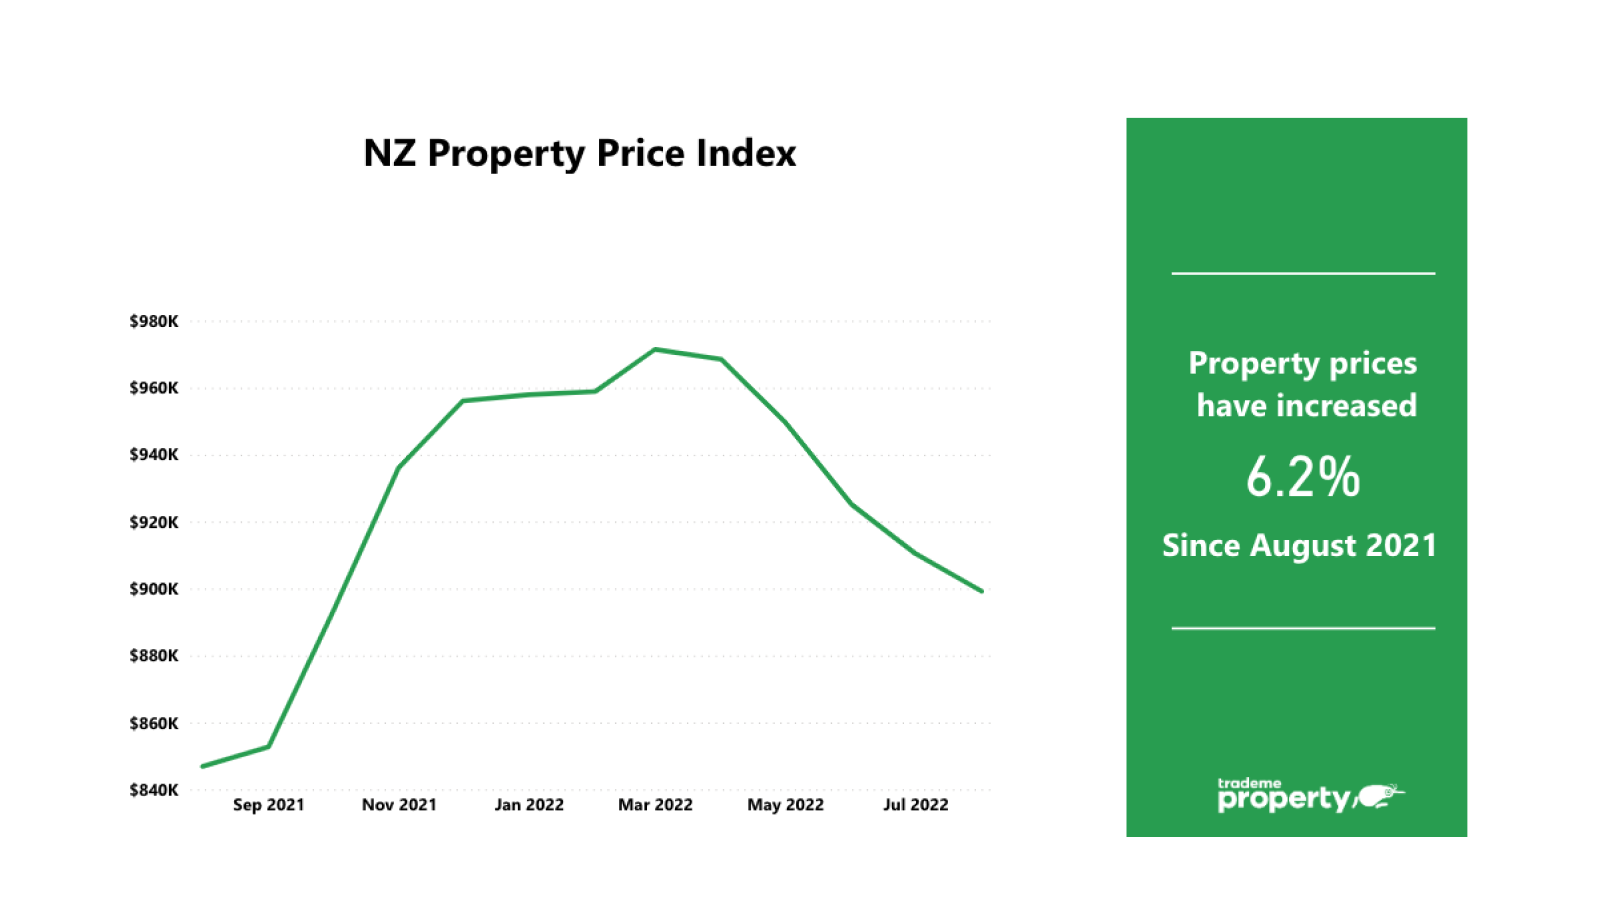
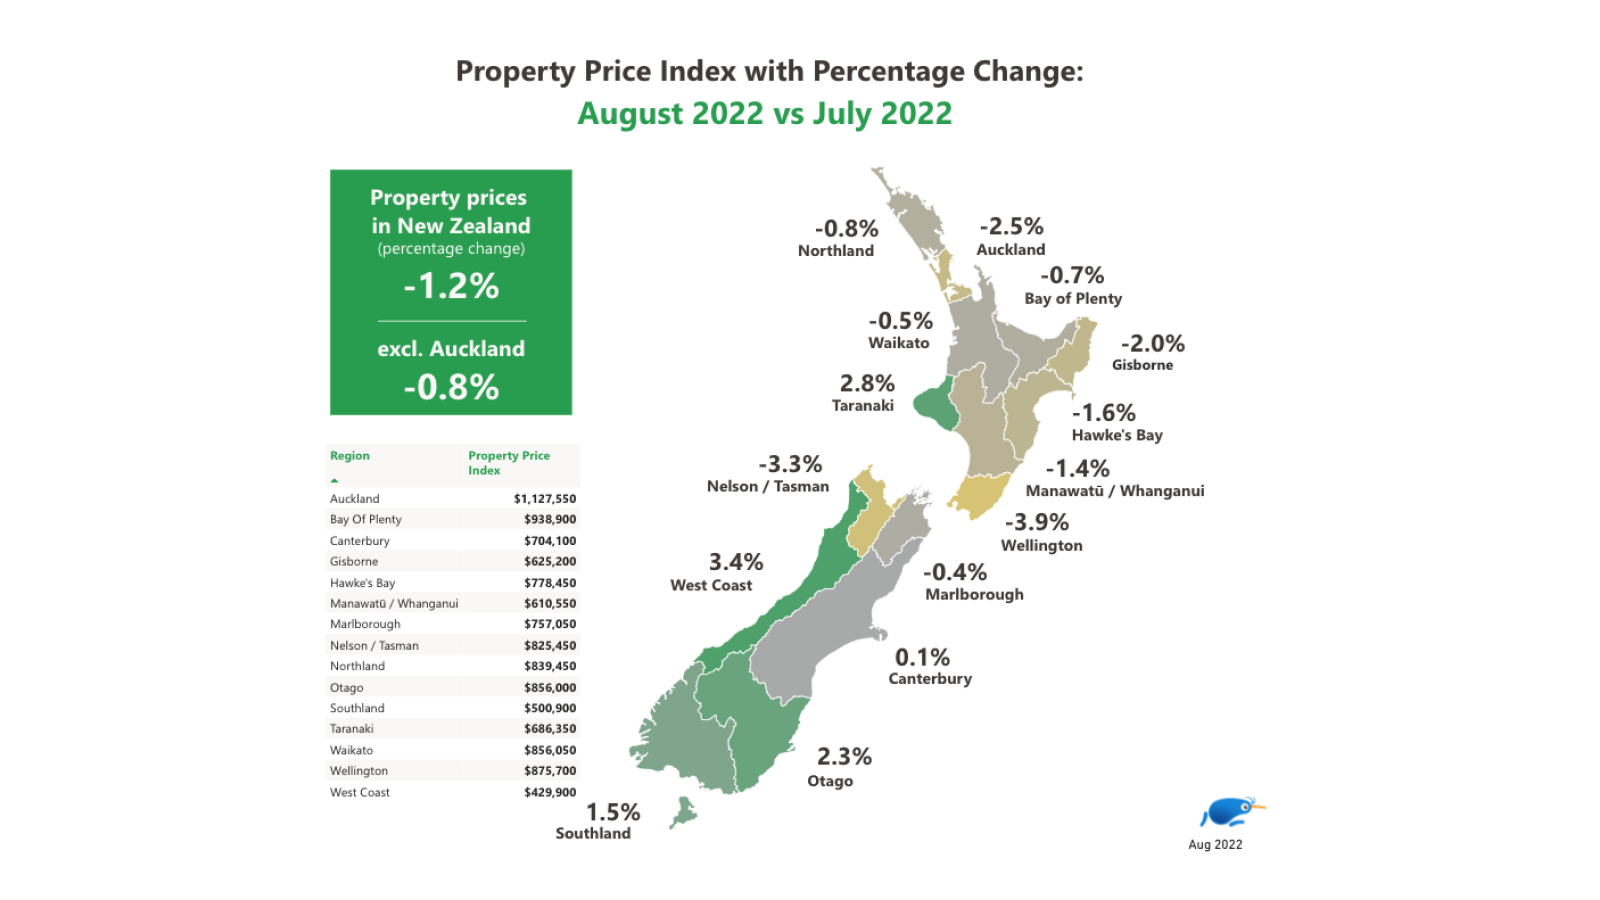
The national average asking price continued on a downward trend, falling to $899,200 in August, down 1 per cent when compared with July. “This is the fifth month in a row where prices have seen a downturn on the month prior, which put the national average asking price below $900,000 for the first time since October 2021.”
The largest month-on-month average asking price drops were seen in Wellington (-4%), Nelson/Tasman, Taranaki, and West Coast ( all -3%). “Prices are falling as a direct result of sky-high supply paired with comparatively low demand, taking the pressure off buyers and forcing sellers to lower their price expectations.”
Looking back to this time last year, the national average asking price for a property was up 6 per cent in August, - the smallest year-on-year increase in over two years.
“August was the second month in a row where prices jumped by less than 10 per cent year-on-year, which is remarkable coming out of two years of consistent double-digit price growth.”
Wellington’s average asking price falls below $900,000
The Wellington region saw an average asking price of $875,700 last month, putting it under $900,000 for the first time since September 2021. “When compared with August 2021, this marks a 1 per cent increase, the smallest year-on-year jump on record for the region.”
Looking at Wellington City, Mr Lloyd said the district’s average asking price fell by 4 per cent month-on-month, to $1,003,300. “Wellington City was still the most expensive district in the region, followed by Porirua ($958,650) and Kāpiti Coast ($884,900).”
The Capital’s most popular property in August was a five-bedroom, four-bathroom house on Murphys Road in Porirua. “The house was watchlisted 414 times in its first seven days onsite.”
Auckland prices see smallest growth in two years
In the Auckland region, August's average asking price jumped 2 per cent when compared with the year prior, to $1,127,550. “This is the smallest jump we have seen since February 2020.”
The most expensive district in the Auckland region last month was North Shore City, sitting at $1,349,200. “Rodney was second ($1,279,000), followed by the Auckland City district where prices fell by 3 per cent month on month to $1,228,600.”
Last month’s most popular Auckland property was a four-bedroom, two-bathroom house on Piha Road in Waitakere City. “It was watchlisted 931 times in its first seven days onsite.”