Buying guide
Mortgage interest rate history NZ: How do today’s rates compare?
Spoiler: The boomers had the highest rates of all


AI summary
Understanding NZ's mortgage rate history provides valuable context for today's homeowners. While current rates are relatively low, they have been extremely volatile, peaking at an astonishing 20.5% in 1987 following deregulation.
Major events like the 2008 Global Financial Crisis and the COVID-19 pandemic caused significant fluctuations. The key lesson is that rates are temporary and unpredictable. Homeowners should focus on ensuring they can afford repayments through economic changes, rather than trying to predict the market.
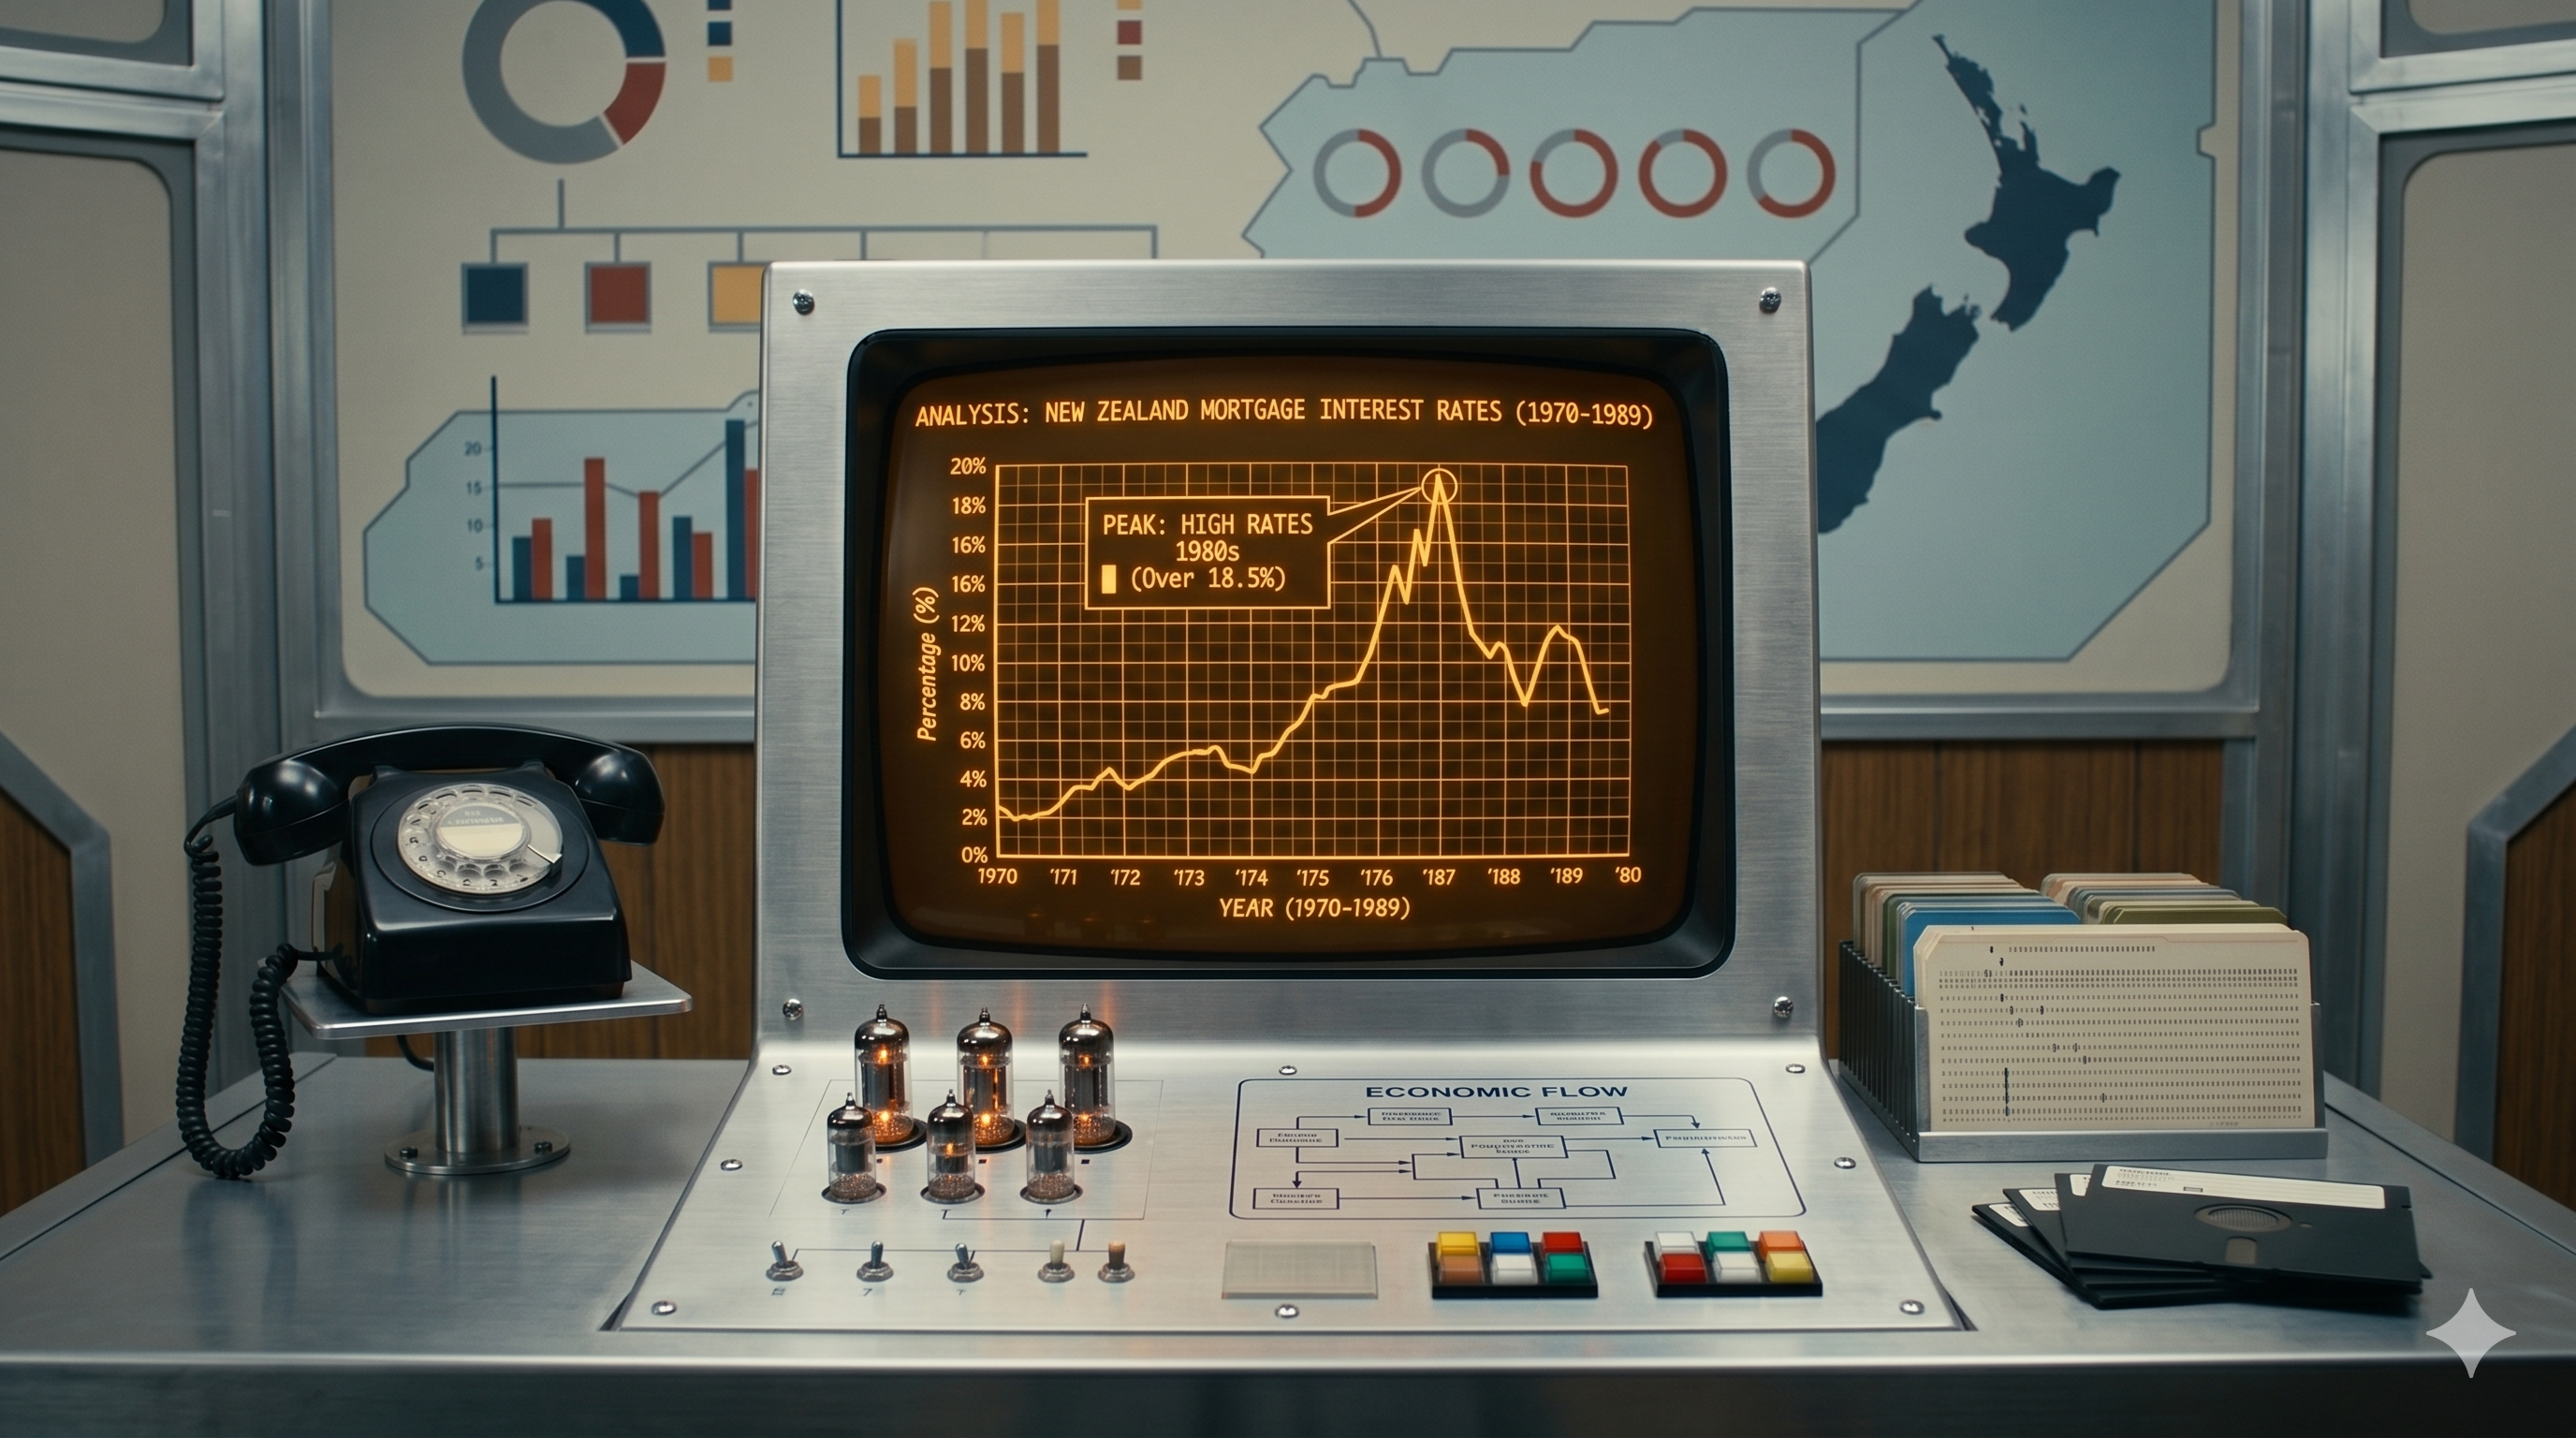
But first, where are interest rates now? (April 2026 averages)
NZ Mortgage rates over time – 2005 to 2026
.png)
Mortgage interest rates from 2004 to 2025 (average EOM)
Why NZ mortgage rates moved – 2005 to 2026
1. The 2008 financial crisis.
2. The COVID-19 pandemic and lockdowns
Could we be looking at the next major event right now?
Let’s go even further back – 1965 to 2005 interest rates
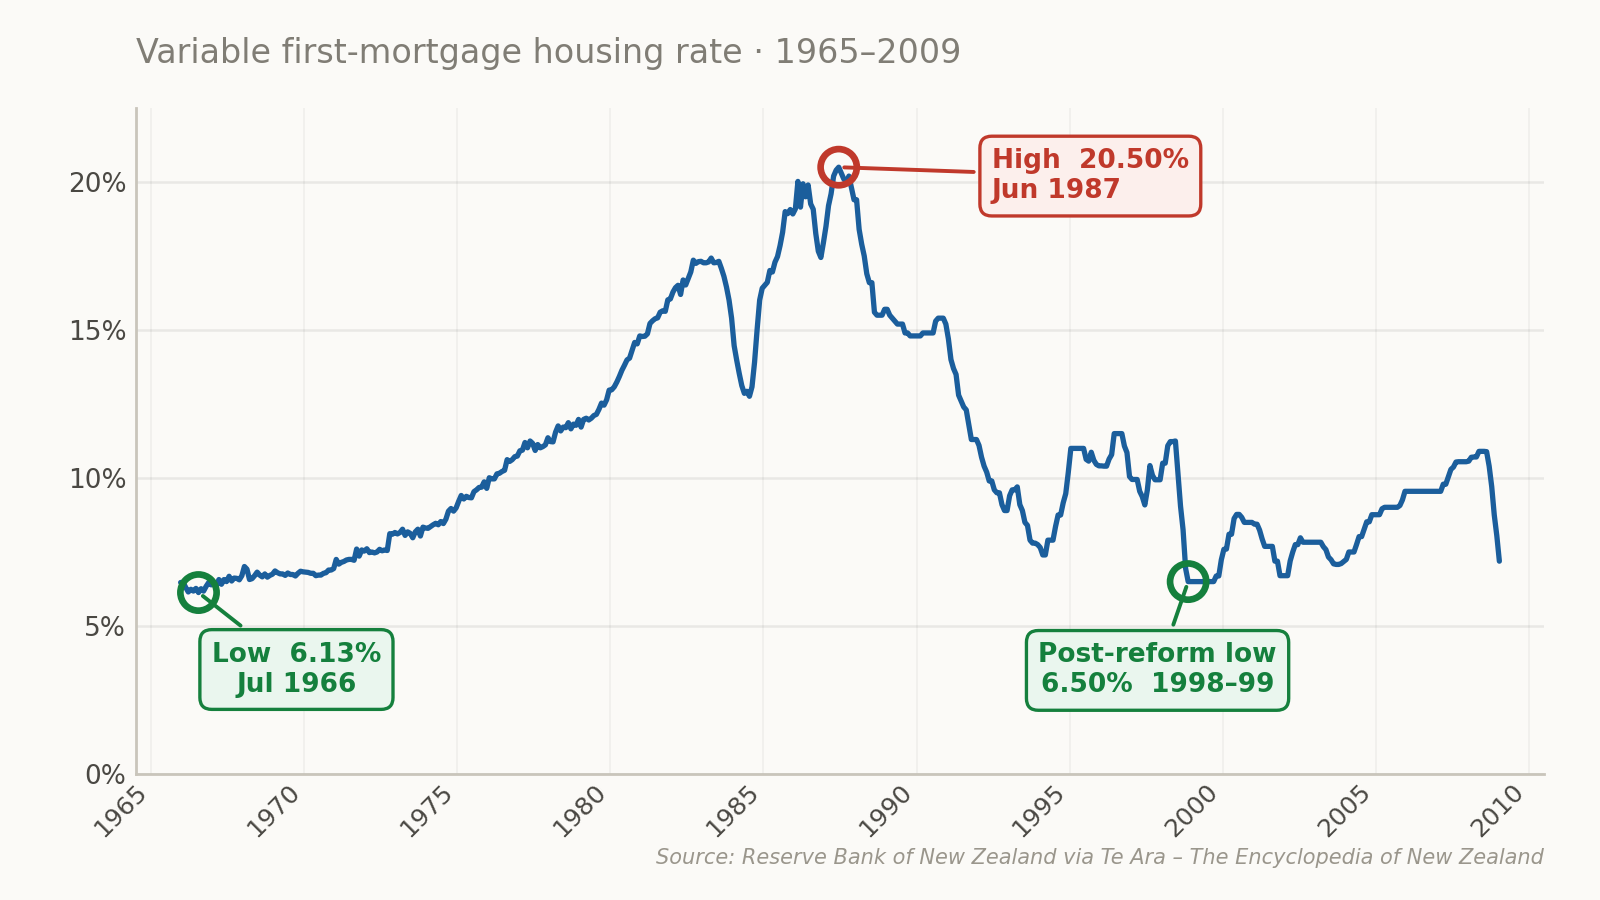
Source - Te Ara The Encyclopedia of New Zealand
1965 – 1972 – Artificially capped rates
1973 – 1981 – Inflation caused by oil shock number one & two
1981 – 1984 – Muldoon’s controls & freezes
1984 – 1987 - Rogernomics and deregulation
1987 – 1989 — The long recession

Interest rates soared to more than 20% in the 80s.
1989 –1997 – The recovery
1998 – 2000 – The Asian financial crisis and more high mortgage rates
2000 – 2008 – Calm before the storm (with a little inflation)
What can we learn about interest rates from all this?
Author




Search
Other articles you might like