News Next article
House prices fall, alongside the temperatures
Property Pulse Report - June 2026
By Gavin Lloyd 16 July 2026.jpg)
Canterbury prices stand steady while both Auckland and Wellington fall.
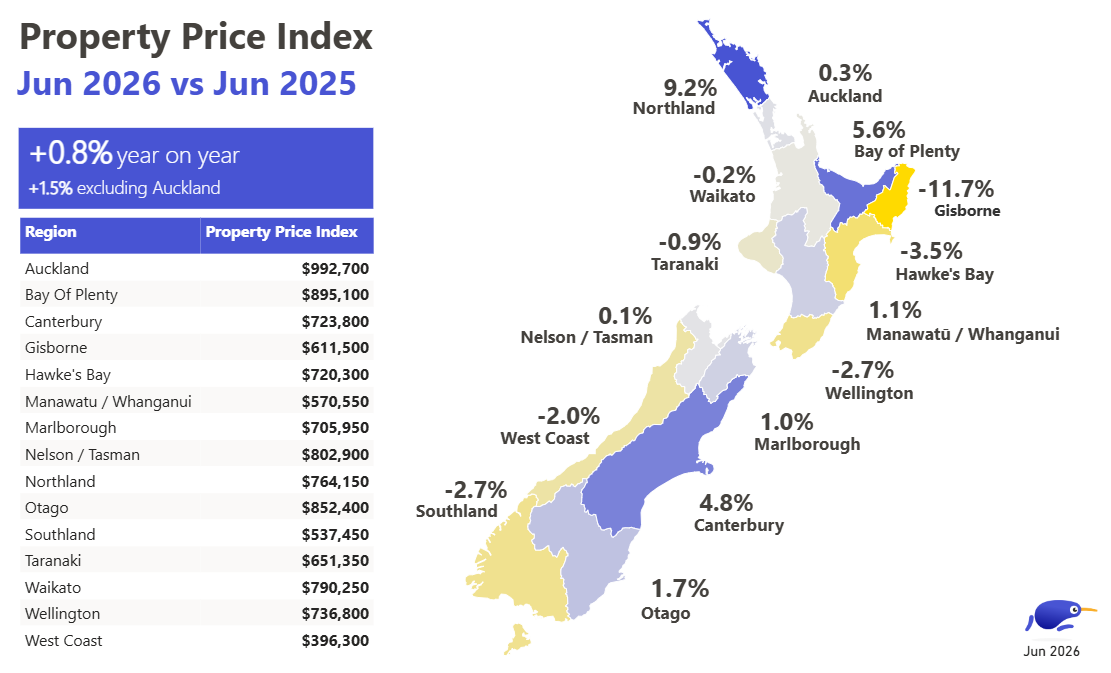
Property prices June 2025 - June 2026
Tāmaki Makaurau falls below $1 million for the first time this year
Northland heats up while major cities chill
| Region | Property Price Index | YoY % change | |||
|---|---|---|---|---|---|
| Auckland | Auckland | $992,700 | $992,700 | 0.3% | 0.3% |
| Bay of Plenty | Bay of Plenty | $895,100 | $895,100 | 5.6% | 5.6% |
| Canterbury | Canterbury | $723,800 | $723,800 | 4.8% | 4.8% |
| Gisborne | Gisborne | $611,500 | $611,500 | -11.7% | -11.7% |
| Hawke's Bay | Hawke's Bay | $720,300 | $720,300 | -3.5% | -3.5% |
| Manawatuū/Whanganui | Manawatuū/Whanganui | $570,550 | $570,550 | 1.1% | 1.1% |
| Marlborough | Marlborough | $705,950 | $705,950 | 1.0% | 1.0% |
| Nelson/Tasman | Nelson/Tasman | $802,900 | $802,900 | 0.1% | 0.1% |
| Northland | Northland | $764,150 | $764,150 | 9.2% | 9.2% |
| Otago | Otago | $852,400 | $852,400 | 1.7% | 1.7% |
| Southland | Southland | $537,450 | $537,450 | -2.7% | -2.7% |
| Taranaki | Taranaki | $651,350 | $651,350 | -0.9% | -0.9% |
| Waikato | Waikato | $790,250 | $790,250 | -0.2% | -0.2% |
| Wellington | Wellington | $736,800 | $736,800 | -2.7% | -2.7% |
| West Coast | West Coast | $396,300 | $396,300 | -2.0% | -2.0% |
Explore Past Property Market Reports
Most properties, more choice
Explore endless possibilities on NZ's favourite property app.
Download for iOS Download for Android 
Author
Other news you might like