News Next article
House prices and listings fall, but demand up
Property Pulse Report - May 2025
By Gavin Lloyd 10 June 2025The national average asking price has retracted with property prices dropping 1.2% to $845,250, according to our latest data.
Our Customer Director, Gavin Lloyd, said that this marked the second consecutive month-on-month decline in the average asking price, following a 0.8% drop in April.
“We saw prices fall across most of the motu in May, with only four exceptions of the 15 Trade Me Property monitors. Southland (+1.2%), Taranaki (+1.5%), the West Coast (+1.4%) and Manawatū/Whanganui (+0.1%) were the only regions showing some signs of growth.”
Metro centre prices hit eight month lows
Auckland, Wellington and Canterbury all recorded their lowest prices since September 2024.
In Tāmaki Makaurau prices fell 1.5% on April and 2.5% year-on-year to $1,030,850. In Wellington the average asking price in May was $805,100, a 0.6% fall on the previous month and down 2.9% on May 2024.
In Canterbury the average asking price fell to $705,650, representing a 0.6% decline both month-on-month and year-on-year.
Gavin Lloyd says alongside price decreases, time onsite is starting to increase.
“Buyers tend to take a little more time in the winter months and the current market is already showing signs of this slow down with median days onsite sitting at 70 in May, up from 62 in April,” said Lloyd.
New Zealand Property Price Index
-1.2% month on month (-1.1% excluding Auckland)
Month-on-Month Change in Average Asking Price
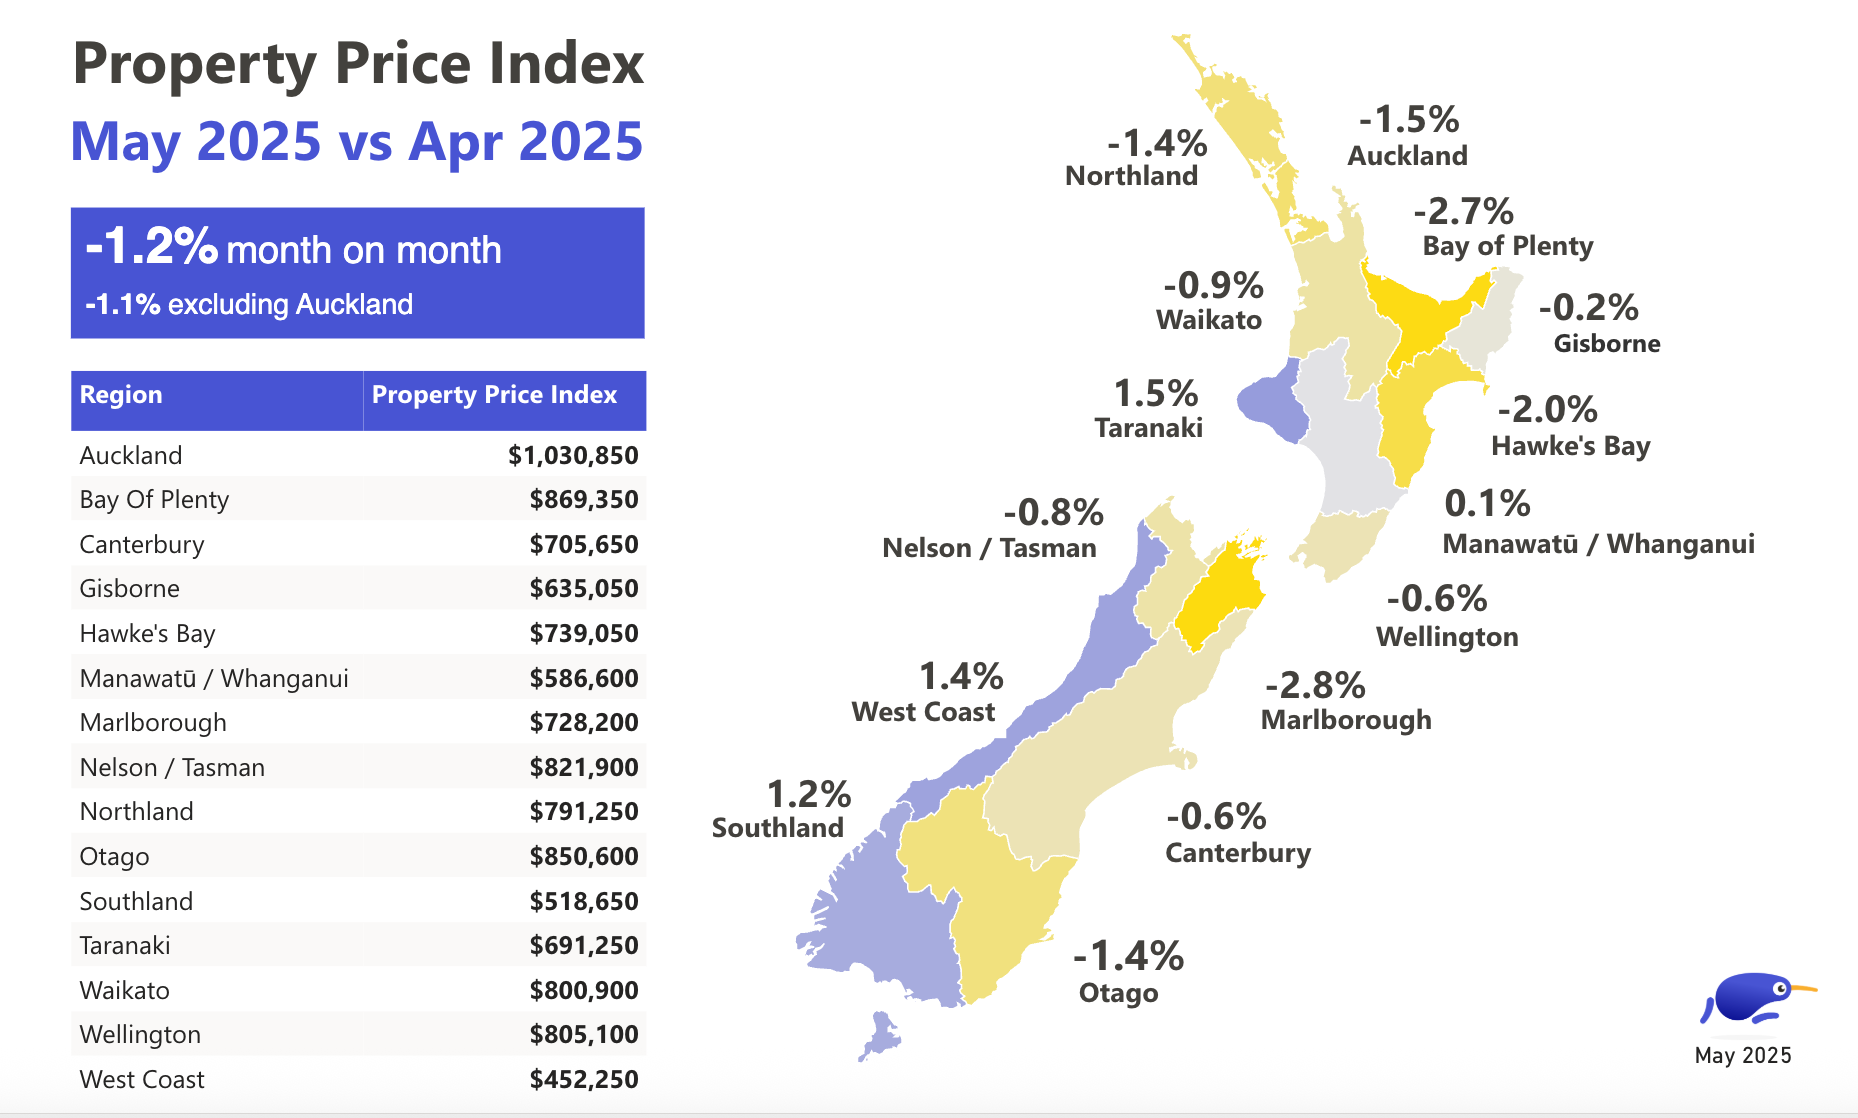
The national average asking price decreased 1.2% from April, bringing it to $845,250.
Region | Property Price Index | MoM % change | |||
---|---|---|---|---|---|
Auckland | Auckland | $1,030,850 | $1,030,850 | -1.5% | -1.5% |
Bay of Plenty | Bay of Plenty | $869,350 | $869,350 | -2.7% | -2.7% |
Canterbury | Canterbury | $705,650 | $705,650 | -0.6% | -0.6% |
Gisborne | Gisborne | $635,050 | $635,050 | -0.2% | -0.2% |
Hawke’s Bay | Hawke’s Bay | $739,050 | $739,050 | -2.0% | -2.0% |
Manawatuū/Whanganui | Manawatuū/Whanganui | $586,600 | $586,600 | 0.1% | 0.1% |
Marlborough | Marlborough | $728,200 | $728,200 | -2.8% | -2.8% |
Nelson/Tasman | Nelson/Tasman | $821,900 | $821,900 | -0.8% | -0.8% |
Northland | Northland | $791,250 | $791,250 | -1.4% | -1.4% |
Otago | Otago | $850,600 | $850,600 | -1.4% | -1.4% |
Southland | Southland | $518,650 | $518,650 | 1.2% | 1.2% |
Taranaki | Taranaki | $691,250 | $691,250 | 1.5% | 1.5% |
Waikato | Waikato | $800,900 | $800,900 | -0.9% | -0.9% |
Wellington | Wellington | $805,100 | $805,100 | -0.6% | -0.6% |
West Coast | West Coast | $452,250 | $452,250 | 1.4% | 1.4% |
Supply and demand
The number of listings on Trade Me Property in May fell 1.3% month-on-month but remained five per cent up on May last year.
Auckland and Taranaki were the only two regions to show listings growth, albeit modest at one per cent. All other regions monitored by Trade Me Property saw a decline in supply between April and May.
In contrast, demand continued to grow, recording a 2.4% increase on April, and up four per cent year-on-year.
Auckland, Canterbury, Southland and Taranaki all saw demand growth of between five and six per cent from April.
“A plentiful supply of properties, coupled with more affordable loan repayments is giving buyers a sense of renewed confidence and motivation,” said Lloyd.
Author
